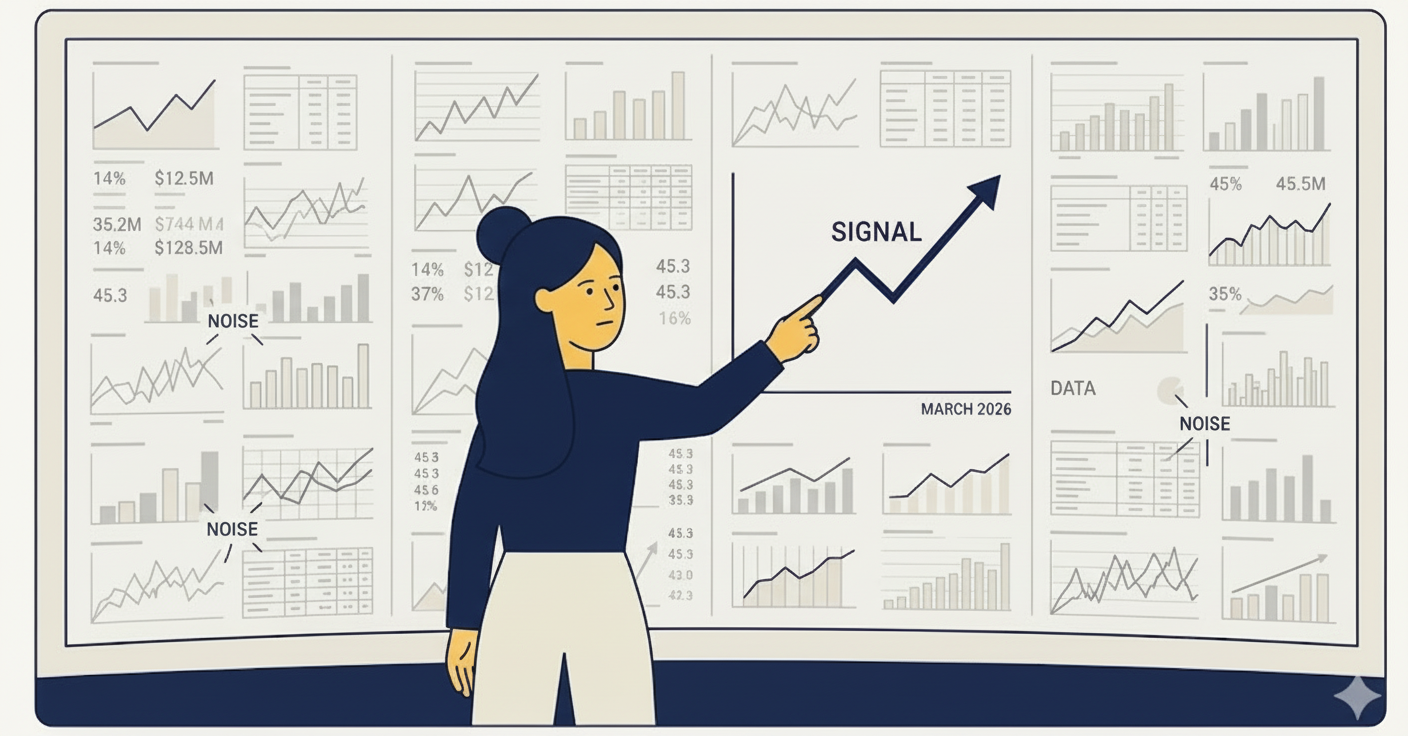
Most social media managers track too many metrics, or the wrong ones entirely. Follower counts, total likes, and impressions can look impressive in a report but tell you very little about whether your strategy is actually working. The metrics that matter are the ones tied to real business outcomes: engagement quality, traffic, conversions, and growth rate.
In this guide, we'll cut through the noise and help you build a focused analytics dashboard that tracks what actually moves the needle.
The Problem with Vanity Metrics
It's easy to get caught up in follower counts and likes. But do these numbers actually move the needle for your business?
Vanity metrics are numbers that look good on paper but don't correlate with business results:
- Follower count: A large audience means nothing if they don't engage
- Total likes: 500 likes on a post seen by 100,000 people is a 0.5% engagement rate
- Impressions: Being seen isn't the same as being remembered or acted upon
The danger of vanity metrics is that they give you a false sense of progress. You might celebrate hitting 10,000 followers while your actual engagement rate is declining. Meanwhile, a creator with 2,000 highly engaged followers is generating more leads and revenue.
The 5 Metrics That Actually Matter
1. Engagement Rate
Not just total engagement, but engagement rate relative to your audience size. This is the single best indicator of content quality and audience connection.
Formula: (Likes + Comments + Shares + Saves) / Followers x 100
Benchmarks by platform:
- LinkedIn: 2-4% is good, 6%+ is excellent
- X (Twitter): 0.5-1% is average, 3%+ is excellent
- Threads: 2-5% is typical for growing accounts
- Instagram: 1-3% is average, 6%+ is excellent
A smaller account with 5% engagement consistently outperforms a large account with 0.5%, both in algorithmic reach and business outcomes.
2. Click-Through Rate (CTR)
How many people actually click your links? CTR measures whether your content is compelling enough to drive action beyond the platform.
Formula: Link Clicks / Impressions x 100
If your CTR is low, your call-to-action might be weak, your content might not build enough curiosity, or you might be targeting the wrong audience. Test different CTA formats and track which ones drive the most clicks.
3. Conversion Rate
Of those who clicked, how many took the desired action: signing up, purchasing, downloading, or subscribing?
Formula: Conversions / Link Clicks x 100
This is where social media meets business results. A high CTR with a low conversion rate suggests your landing page or offer needs work, not your social content.
4. Share of Voice
How much of the conversation in your industry are you capturing compared to competitors? Track brand mentions, tagged posts, and relevant keyword conversations to understand your visibility.
How to measure:
- Track mentions of your brand vs. competitors using social listening tools
- Monitor relevant hashtags and keywords
- Measure the percentage of industry conversations you participate in
5. Audience Growth Rate
Not total followers, but the rate of growth over time. This tells you whether your content strategy is attracting new people consistently.
Formula: New Followers in Period / Total Followers at Start x 100
A steady 5% monthly growth rate is more sustainable and valuable than a viral spike followed by a plateau.
Metrics by Goal
Different business goals require different metrics. Here's how to align your tracking with your objectives:
Brand Awareness
- Reach and impressions (as directional indicators, not goals)
- Brand mentions and tags
- Share of voice
- Content save rate (people bookmarking your content for later)
Engagement & Community
- Engagement rate
- Comments per post (depth of conversation)
- Saves and shares (high-value engagement)
- Reply rate on stories/threads
Traffic & Leads
- Click-through rate
- Website traffic from social (use UTM parameters)
- Lead generation form completions
- Email list growth from social
Sales & Revenue
- Conversion rate
- Revenue attributed to social
- Customer acquisition cost from social
- Return on ad spend (for paid campaigns)
Building Your Analytics Dashboard
The key is focus. Track 5-7 key metrics that align with your current primary goal, not 30 metrics that dilute your attention.
Weekly review: Spend 15 minutes every Monday reviewing your numbers. Look for:
- Which posts performed above average?
- Which performed below?
- Any patterns in timing, format, or topic?
Monthly review: Take 30-60 minutes at month's end for strategic analysis:
- Is your engagement rate trending up or down?
- Which content themes drove the most business outcomes?
- Are you growing on the platforms that matter?
- What should you do more of? Less of?
Quarterly review: Zoom out and evaluate your strategy:
- Are you meeting your business goals?
- Should you shift platform focus?
- Do you need to adjust your content calendar?
Common Analytics Mistakes
- Comparing yourself to others. Your metrics should improve over your baseline, not someone else's. Different niches, audience sizes, and strategies produce different numbers.
- Ignoring context. A viral post isn't always a good post. If it attracted the wrong audience, it may actually hurt your engagement rate long-term.
- Measuring everything. Focus beats comprehensiveness. Pick your 5-7 metrics and ignore the rest.
- Not acting on data. Insights are worthless without action. Every analytics review should produce at least one concrete change to your strategy.
- Checking too frequently. Daily analytics checks create anxiety without actionable insight. Stick to weekly reviews.
- Forgetting qualitative data. Numbers don't capture everything. Read your comments. Notice which posts spark meaningful conversations vs. surface-level reactions.
Tools for Social Media Analytics
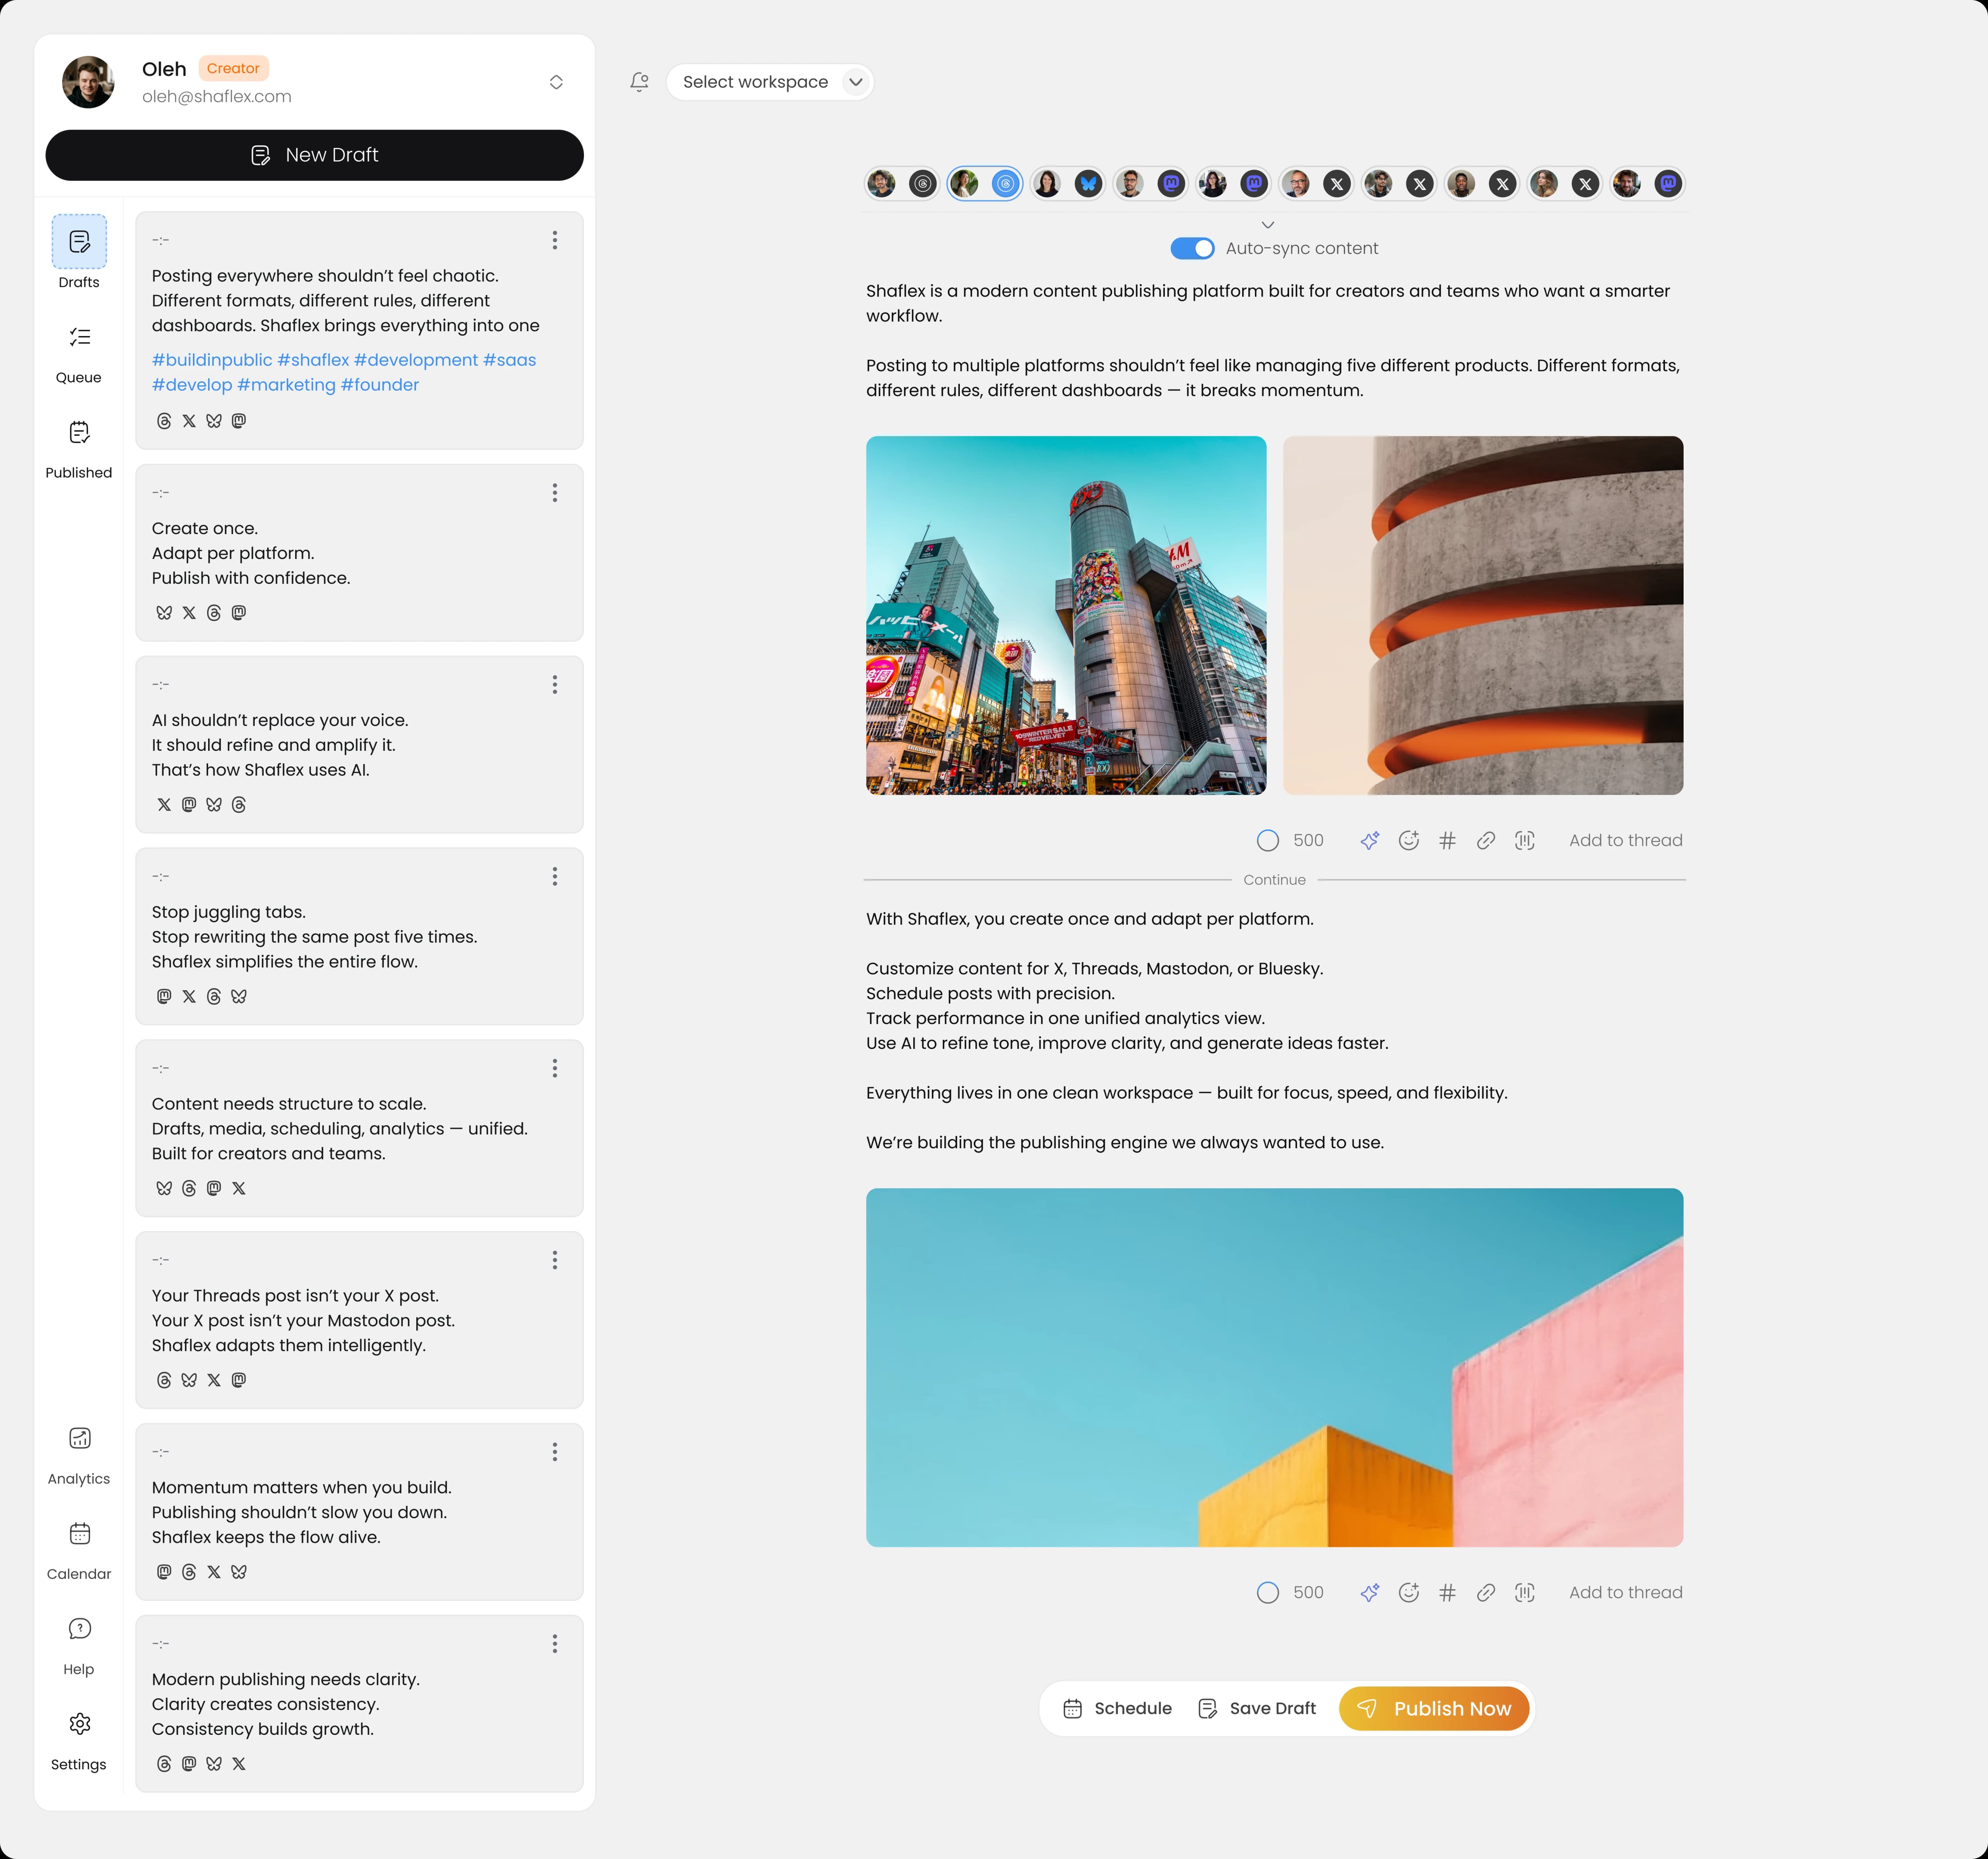
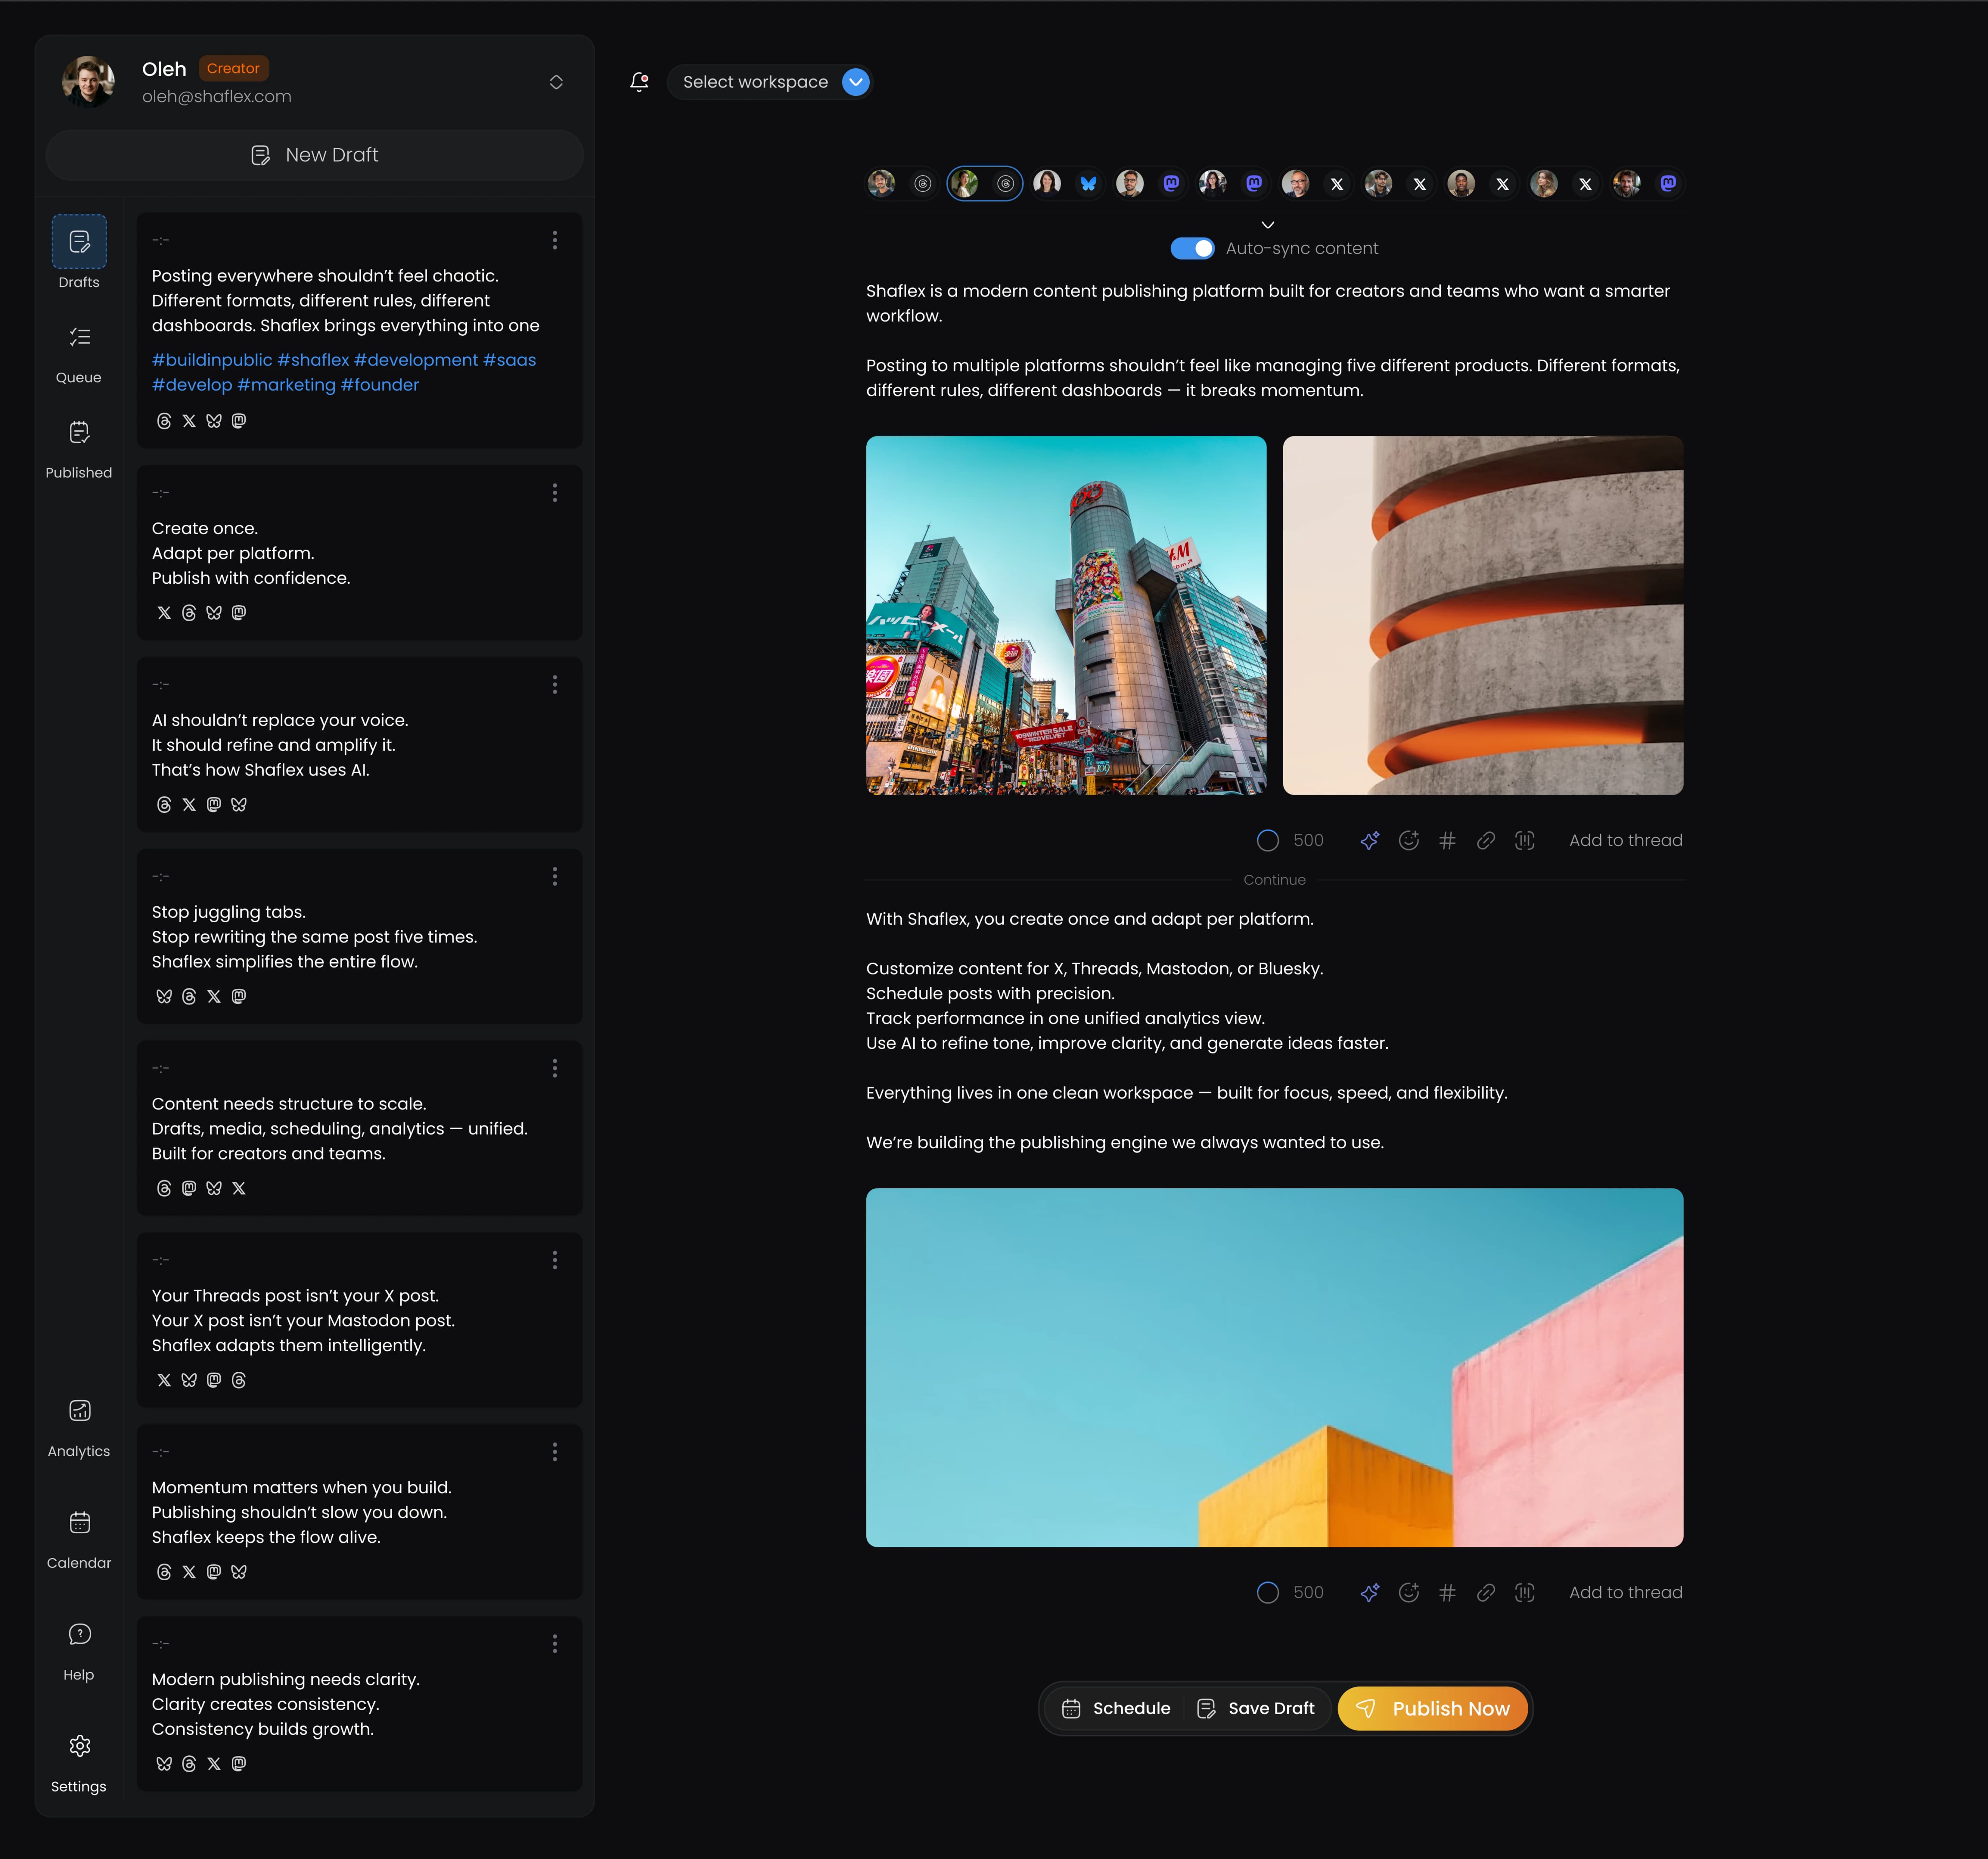
Most platforms offer built-in analytics, but they only show data for that single platform. For a cross-platform view, you need a unified dashboard.
When scheduling your content with a tool like Shaflex, you can see how your posts perform across Threads, X, BlueSky, Mastodon, and LinkedIn, all in one place. This makes it much easier to spot cross-platform patterns and optimize your strategy holistically.
Conclusion
Stop chasing vanity metrics. Define what success looks like for your brand, pick 5-7 metrics that align with those goals, and use that data to continuously improve your strategy.
The best social media strategies are built on feedback loops: create content, measure results, learn, and iterate. Start with your engagement rate and CTR. These two metrics alone will tell you more about your content's effectiveness than any follower count ever could.
Ready to track your performance across all platforms? Try Shaflex for free and see how your content performs everywhere you publish.
Frequently asked questions
- What are the most important social media metrics?
- Five: engagement rate (likes + comments + shares + saves divided by followers × 100), click-through rate, conversion rate, share of voice (your % of industry conversations), and audience growth rate (new followers / starting followers × 100). Together these track quality, action, business outcomes, visibility, and trajectory. Everything else is noise.
- What is a good engagement rate on social media?
- Platform benchmarks: LinkedIn 2–4% is good, 6%+ is excellent; X (Twitter) 0.5–1% is average, 3%+ excellent; Threads 2–5% typical for growing accounts; Instagram 1–3% average, 6%+ excellent. A small account with 5% consistently outperforms a 10x-larger account at 0.5% in both algorithmic reach and revenue.
- Are follower count and likes useful metrics?
- Mostly no; they're vanity metrics. 500 likes on a post seen by 100,000 people is a 0.5% engagement rate, which is poor. Hitting 10,000 followers means nothing if engagement is declining. Track these as background context only; never make decisions based on them. Engagement rate, CTR, and conversion are what predict business outcomes.
- How do you measure social media ROI?
- Stack three metrics: CTR (does content drive clicks?), conversion rate (do clicks turn into signups/sales?), and customer acquisition cost. If CTR is low, your CTAs are weak. If CTR is high but conversion is low, your landing page is the problem, not your content. ROI = (revenue from social conversions − cost of content production) / cost.
- Should you track different metrics for different goals?
- Yes. For brand awareness: impressions, reach, share of voice, follower growth. For lead generation: CTR, conversion rate, cost per lead. For community building: engagement rate, comment quality, replies per post. Don't track all metrics for all goals; pick 3–4 that align with the specific outcome and ignore the rest.
- How often should you review social media analytics?
- Weekly for tactical decisions (what's working, what to double down on), monthly for strategic decisions (which platforms, content pillars, posting cadence), and quarterly for big-picture review (ROI, audience composition, channel mix). Daily checking creates anxiety without information. Engagement varies day to day; trends emerge over weeks.
 Apr 22, 2026